Quantified global scenarios and projections are used to assess long-term future global food security under a range of socio-economic and climate change scenarios. Here, we conducted a systematic literature review and meta-analysis to assess the range of future global food security projections to 2050. We reviewed 57 global food security projection and quantitative scenario studies that have been published in the past two decades and discussed the methods, underlying drivers, indicators and projections. Across five representative scenarios that span divergent but plausible socio-economic futures, the total global food demand is expected to increase by 35% to 56% between 2010 and 2050, while population at risk of hunger is expected to change by −91% to +8% over the same period. If climate change is taken into account, the ranges change slightly (+30% to +62% for total food demand and −91% to +30% for population at risk of hunger) but with no statistical differences overall. The results of our review can be used to benchmark new global food security projections and quantitative scenario studies and inform policy analysis and the public debate on the future of food.
The question of how to eradicate global hunger—one of the Sustainable Development Goals—and feed the future world population is a major global societal challenge. To support the formulation of effective policies to ensure global food security, a better understanding of the range of future outcomes and main driving forces is needed. Global assessments have mainly used four broad indicators to measure the various dimensions of food (in)security: food demand 1,2 , population at risk of hunger 3,4 , food prices 5 and childhood undernutrition 6 . Often, the results of these studies vary widely and are difficult to compare because of differences in methods 7 , assumptions on driving forces 8 and definitions of output indicators 9 . To date, no comprehensive analyses of global food security projections have been presented. The aim of this paper is to provide a review of recent global food security projection and quantitative scenario studies that provide trends to 2050. Collecting and comparing quantitative scenario results to assess model uncertainty has been a common practice in the climate change literature 10 but has not been done for global food security assessments. The main question addressed in this review is: what is the range of future global food security projections to 2050? To answer this question and to better understand why projections differ, we also review the methods and indicators that have been used in the modelling studies.
We applied a systematic literature review approach to identify and collect relevant studies that were published between 2000 and early 2018, followed by a meta-analysis to assess the range of global food security projections for the period 2010–2050. We identified and analysed 57 relevant studies and constructed a database with harmonized projections for two of the four global food security indicators used in the literature: global food demand (593 projections) and global population at risk of hunger (358 projections), representing a wide range of plausible socio-economic and climate change futures.
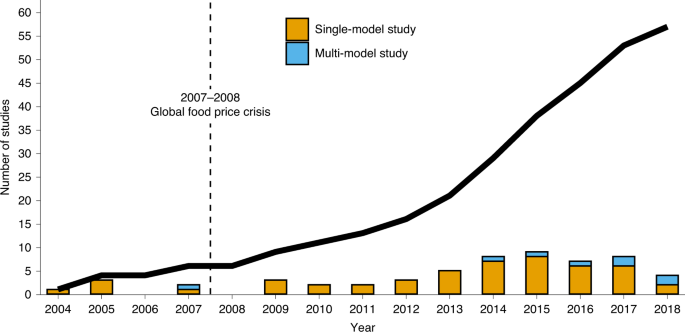
We selected 57 global food security projection studies for further review using a predetermined systematic review protocol (Extended Data Fig. 1, Supplementary Information and Methods). Figure 1 shows that the number of studies increased substantially over the past two decades. The increase in publications after 2009 can almost certainly be attributed to the renewed interest in global food and nutrition research that was triggered by the 2007–2008 global food price crisis 11 . In recent years, there has been a transition from single-model studies to multi-model comparisons that present and discuss the results of an ensemble of models. Many of these studies are produced as part of the Agricultural Model Intercomparison and Improvement Project 12 .
Three different methods have been used to assess future global food security (Fig. 2a). The majority of studies (n = 47) employ simulation models, while some use statistical extrapolation approaches (n = 9) that use regression techniques to estimate future food security 1,13 . Only one study 2 mainly used expert input to prepare the projections. The IMPACT model 14 was the most frequently used simulation model (n = 16, Fig. 2b). This is not surprising, as it was already developed in the early 1990s by the International Food Policy Research Institute (IFPRI) to analyse long-term hunger and poverty challenges. The set of models that form the core of the global assessment component of the Agricultural Model Intercomparison and Improvement Project are also often applied in global food security assessments. Apart from the IMPACT model, these include GLOBIOM 15 , MAGNET 16 , AIM/CGE 17 , IMAGE 18 and MAgPIE 19 . Other often-applied models are SIMPLE 20 , BLS 3 and ENVISAGE 21 . The most frequently used type of models is partial equilibrium models (n = 42), followed by computable general equilibrium market simulation models (n = 28) and other types of models (such as integrated assessment, biophysical and economic; n = 11).
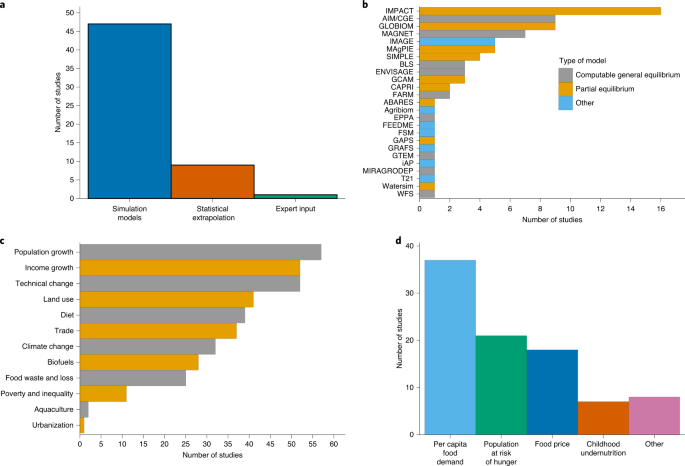
Global food security is a complex issue that is determined by the interaction of a multitude of driving forces that operate on both the demand and supply sides. Nearly all studies include assumptions on future population (n = 57) and income growth (n = 52), which are key drivers of food demand, and assumptions on technical change (including total factor productivity growth, crop yield increase and adoption of advanced inputs) (n = 52), which is the main driver of food supply (Fig. 2c). Other drivers that are covered by more than half of the studies include land availability (such as protected areas and land degradation) (n = 41), diet change (n = 39), trade (n = 37) and climate change (n = 32). Only a very small number of studies indicate that they explicitly address the impacts of aquaculture (n = 2) 22,23 and urbanization (n = 1) 23 on global food supply and demand projections.
A large number of the selected studies present future trends for two indicators (Fig. 2d). The first is per capita food demand, in most cases measured as the average diet per person (sum of crops, dairy, fish and meat in kcal per capita per day) (n = 37). The second indicator is global population at risk of hunger (n = 21), which implements the prevalence of undernourishment—the main statistic used by the Food and Agriculture Organization (FAO) to measure the number of hungry people 24 —in a forward-looking framework. Food price (n = 18) and, to a lesser extent, childhood undernutrition (n = 7) are other popular indicators. A few studies (n = 8) present alternative indicators, including protein consumption 25,26 , people at risk of protein deficiency 27 and recommended daily intake of macronutrients 26 . Shutes et al. 28 build on a set of historical food security indicators prepared by the FAO (for example, share of calories from cereals, fruit and vegetables) to assess future global food security.
The distribution of food security outcomes within and between studies is determined by the combination of (1) varying assumptions on key drivers, often related to a scenario storyline on how the future might unfold, and (2) differences in method, such as the type and parameterization of the model and how the results are reported. To unravel these two factors, we mapped all projections to the Shared Socio-economic Pathways (SSPs; see Extended Data Fig. 2 for a summary of these scenarios) and the Representative Concentration Pathways (RCPs), a combination of socio-economic and climate change scenarios 29,30,31,32 , which are frequently used in global assessments 33,34 . For a subset of the selected studies, we were able to extract and harmonize projections for the two most used indicators: per capita demand (n = 21) and population at risk of hunger (n = 14).
Figure 3 presents two indicators for the future trends in food demand: change in per capita consumption (in kcal per capita per day) and change in total food consumption (in 1 × 10 15 kcal). The latter captures the combined impact of changes in the diet and growth in population (Extended Data Fig. 3). Nearly all SSP scenarios project an increase in per capita and global food consumption in comparison with the 2010 levels, but the relative sizes of these increases differ. In future worlds that are characterized by fragmentation (SSP3) and inequality (SSP4), per capita consumption will increase by 4% to 7%, while in scenarios that assume sustainability (SSP1), business-as-usual development (SSP2) and rapid growth (SSP5), the increase is 12% to 16%. Taking population growth into account, total food consumption increase is the lowest in SSP1 (+41%) and the highest in SSP2 (+51%).
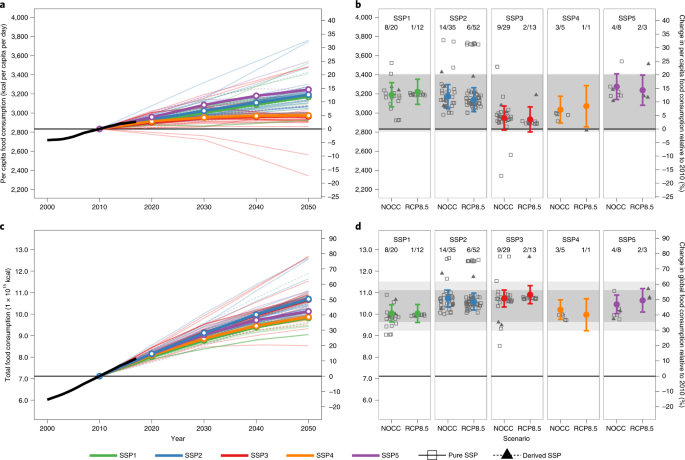
The distribution of projections within each SSP illustrates the uncertainty caused by methodological differences between studies. The figure shows that the results of several studies can be considered as less plausible because they are located outside the 95% confidence interval. If the confidence band of all SSPs is jointly taken into account, the plausible bandwidth of per capita food consumption becomes +0% to +20% and of total food consumption becomes +35% to +56%. Figure 3 also compares the results between no climate change (NOCC) and extreme climate change (RCP8.5) scenarios (see Extended Data Fig. 4 for a comparison with a wider range of RCPs). If the uncertainty related to climate change is also taken into account, the ranges of per capita (−1% to +20%) and total food demand (+30% to +62%) projections change slightly. However, a pairwise comparison did not provide evidence that climate change results in significantly different patterns of food demand compared with NOCC (Supplementary Fig. 7).
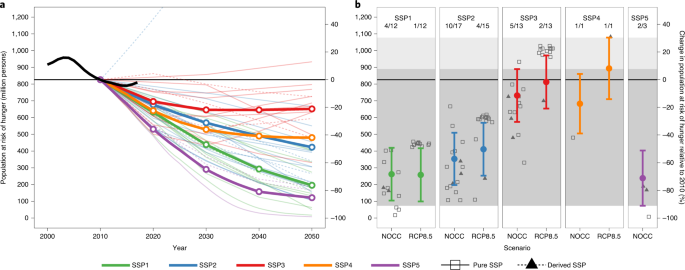
Figure 4 depicts the projections for population at risk of hunger. Nearly all projections point to a decrease in undernourishment in comparison with the base year. The change is highest in SSP1 and SSP5, with NOCC point estimates of −71% to −68%, while it is smallest in SSP3 (−11%), and SSP2 and SSP4 are located in the middle (−57% to −17%). If the 95% confidence interval is considered, the projected change in population at risk of hunger lies between −91% and +8% for NOCC projections and between −91% and +30% for climate change projections (Extended Data Fig. 5). Again, we did not find evidence that climate change projections are statistically different from NOCC projections (Supplementary Fig. 7).
The expected increase in food production and associated impacts on land use change, biodiversity and climate change depend heavily on projections of global food demand and consumption. The most cited figure, originating from an FAO briefing paper 35 , states that world food production needs to increase by 70% to feed the world population in 2050. Although this number was reduced to 60% in a revision of the original study 2 , it continues to be used as a reference point by companies 36 and scientific papers 37 . Another widely cited paper is Tilman et al. 1 , who present a much higher increase in global food demand of 100–110% between 2005 and 2050. Opponents of mainstream agriculture often dismiss global food future projections and scenarios because they believe that the cited 60–110% increase in food demand (or its doubling, for short) erroneously frames global food security as a problem of supply (or even scarcity), closing off discussions of solutions that do not principally rely on increasing food production through technological innovation. Such solutions include the adoption of food sovereignty principles (for example, agro-ecological approaches that stress the value of indigenous knowledge, culture and peasant autonomy) as well as radical non-market-driven changes in diets 38,39,40 .
How do the +60% to +110% figures compare to our findings? We find that under SSP2 (which, like the FAO projections, is regarded as a business-as-usual scenario), total food consumption will increase by 51%, with a 95% confidence interval of +45% to +56%. This is substantially lower than the FAO 2 and Tilman et al. 1 projections of 60–110%.
There are at least two reasons for the difference 41,42 . The main reason is that the FAO trend is estimated using the earlier base year 2005/2007 and therefore overestimates the expected increase in food consumption in comparison with the 2010 base year that is used in our review. The second reason is that it measures food consumption in value terms using food prices as weights instead of the preferred calorie-based measure 43 . The value-term measure tends to overestimate food consumption in the case of a diet shift from low-price staples towards higher-value products that might have occurred since 2005/2007. Interestingly, the latest update of the FAO study 2 also presents a projection of 54% for the global change in calories. Using a base year of 2010, this translates to an increase in consumption of 44%, which is just outside the confidence interval for SSP2. This shows that the FAO projections are comparable to those of other studies, but the results are highly sensitive to the selection of the base year. Without mentioning the reference period, statements about future increases in food demand and production can be severely misleading.
The projections in Tilman et al. 1 cannot easily be compared with most of the studies in our review because of differences in approach. In contrast to most other studies, which use diet projections, food consumption is approximated by total crop calories (including food and feed), resulting in much higher per capita projections. The study implicitly assumes that food and feed have the same relationship with income per capita. This deviates from most model studies, which assume an increase in feed-to-food conversion efficiency rates 44 and hence a lower relative future demand for feed. Not accounting for potential efficiency improvements in the livestock sector might explain why the food consumption projections in Tilman et al. 1 are nearly twice as large as those in most other studies.
The 95% confidence intervals of the point estimates show that there is a degree of uncertainty in the projections. Three factors may explain the high variation in observed food security outcomes 9 . First, in contrast to model comparison exercises 45 , where all models use harmonized assumptions on drivers and attempt to align the implementation of qualitative scenario assumptions, the input data of the studies in our review are not fully aligned despite our effort to map all projections to the SSP scenario framework. It seems that even ‘pure’ SSP studies use slightly different projections for core SSP building blocks, such as population growth, resulting in a variation of outcomes (Extended Data Fig. 3).
Second, differences in methods for modelling long-run global food security can strongly influence the results 7,46 . Systematic model comparisons showed that structural differences between assumptions on technological change 47 , the way food demand is modelled 48 and the type of model 45 are important factors that explain differences in projections. Using our meta-regression, we formally tested the impact of model type on global food security projections but did not find convincing evidence to support this (Supplementary Section C).
Finally, differences in the way results are reported, such as differences in base year or definitions of indicators, potentially explain the wide range of outcomes. As one of the main aims of this study was to harmonize the food security projections to make them comparable, we do not expect this factor to be of major influence.
After all projections are harmonized and observations outside the 95% confidence interval (which can be considered as less plausible) are discarded, the projections are largely consistent. SSP1 and SSP5 represent futures in which global food security will improve, reflected by a sharp decrease in population at risk of hunger, high levels of food consumption per capita and low total food consumption. SSP3 represents an opposite world, characterized by the highest population at risk of hunger, the lowest per capita consumption and the highest total food consumption. In most cases, the results for SSP2 and SSP4 are located in the middle of these extreme scenarios. The consistency of the SSPs is also supported by a pairwise comparison, which shows that the point estimates are statistically different for more than half of the SSP combinations (Supplementary Fig. 6).
Our findings indicate that, under NOCC, per capita and total food demand are expected to change by +0% to +20% and +35% to +56% between 2010 and 2050, respectively, while population at risk of hunger is projected to change by −91% to +8%. Projections that account for climate change show a somewhat wider range of outcomes (−1% to +20% for per capita food demand, +30% to +62% for total food demand and −91% to +30% for population at risk of hunger). These figures reflect global food security outcomes in five vastly different but plausible future worlds with respect to sustainability, equality and technological development. We believe that these findings are more reflective of the current state of the literature than the often-cited range of +60% to +110% for food demand, which represents only business-as-usual scenarios.
Moreover, in the light of the current coronavirus pandemic, which undoubtedly will have a lasting impact on all aspects of future global development (including food supply and demand), business-as-usual scenarios can no longer be considered plausible or realistic. According to the World Food Programme, trade barriers put up by some countries to safeguard national food security in combination with an economic slowdown were expected to double acute hunger by the end of 2020 (ref. 49 ). Although it is too early to understand the full impact and consequences of the coronavirus pandemic, current developments show some resemblance with the SSP3 Regional Rivalry scenario, which is characterized by slow economic development, a focus on domestic security and sovereignty, and increasing inequality within and between nations. The recent developments underscore the need for quantitative scenario analysis and comparison as a tool to inform policy analysis, coordination and planning for the future of food and wider societal issues.
To select relevant studies on global food security projections, we followed the systematic review guidelines prepared by the EPPI-Centre (https://eppi.ioe.ac.uk; see ref. 50 ). Our approach included five steps: (1) definition of research questions and preparation of research protocol, (2) search for relevant studies, (3) screening and selection of studies, (4) data extraction and (5) analysis. The core of the literature review was conducted between September and December 2017, but an additional search using the same approach was conducted around mid-2018 to cover the studies that were published in the first half of 2018. The main steps are summarized below. Additional details can be found in the review protocol (Supplementary Information).
We combined a number of search strategies to identify relevant studies: (1) we searched five electronic search engines of bibliographic databases (Scopus, Econlit, CAB abstracts, Agricola and Agris) using a combination of search terms; (2) we used Google Scholar, but only including the first two pages with references; (3) we consulted websites of organizations and institutions (for example, FAO, the Organisation for Economic Co-operation and Development, the World Bank and the International Food Policy Research Institute), which occasionally prepare global food security assessments; (4) we consulted experts working on the topic to inquire about relevant studies; and (5) we conducted a ‘snowballing’ exercise on all references from several global food security review studies, as these studies are assumed to bring together important literature.
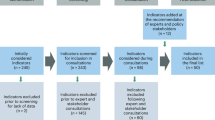
The literature search generated a list of potentially relevant studies that were subsequently screened by applying a set of exclusion criteria. The query of the scientific literature repositories resulted in 3,667 unique studies. After abstract and full text screening, 57 studies were selected to be included in the systematic literature review (Extended Data Fig. 1; see Supplementary Section E for the list of studies). Finally, we used a questionnaire to systematically extract and code relevant information, including metadata, methods used, scenario information, food security indicators and main drivers. All data were stored in a database that is available for download.
For practical purposes, we decided to limit the collection and harmonization of data to two indicators that were presented in the majority of studies: per capita food consumption (in kcal per capita per day) and population at risk of hunger (in million persons). We also collected information on population projections to prepare total food consumption projections (in kcal). For a variety of reasons (Supplementary Section A.1), we were able to extract quantitative and comparable information on global food security projections from only 26 (46%) of the 57 studies that resulted from the systematic literature review. All data were subsequently cleaned, harmonized and stored in a database (Supplementary Section A). The Global Food Security Projections Database contains 593 projections of food consumption per capita and total food consumption and 358 projections of population at risk of hunger.
To make the data comparable across studies and over time, we mapped the projections to the SSPs 31,32 . The SSPs were originally designed as a framework for the recent climate change assessments but have been increasingly used for the evaluation of other global challenges, including food security. Around 88–90% of the projections (Supplementary Fig. 4) already use the SSPs to produce food security projections. For all other projections, we built on Van Vuuren et al. 51,52 , who demonstrated that the assumptions of many global socio-economic scenarios (including the SSPs) are similar and can be classified into five archetypal scenario ‘families’. We assumed that projections based on the SSPs and projections based on scenarios with the same characteristics (that is, belonging to the same ‘family’) can be directly compared. However, as the assumptions underlying these scenarios are not exactly the same as those of the SSPs, we labelled them as derived SSPs. We used the tables in Van Vuuren et al. 51,52 to map the majority of these projections to the SSPs. For all remaining studies, we added the mapping by comparing the storylines and directions of drivers with the description of the scenario families (Supplementary Table 1). We used a similar approach, drawing on Van Vuuren and Carter 52 , to map all climate change projections to the RCPs (Supplementary Table 2). A small number of projections could not be mapped to one of the SSP scenario families. We labelled them as ‘No class’ and excluded them from further analysis but added them to the Global Food Security Projections Database fur further reference.
Finally, we divided the projections into ‘baseline’ and ‘policy shock’ projections (Supplementary Fig. 5). The first type is based on the assumptions of baseline scenarios, which assume that socio-economic development, including global food security, will be determined by future changes in the socio-economic drivers (and associated major policy changes that can be regarded as exogenous to the analysis) 53 . The SSPs are generally considered as baseline scenarios. The second type is used to investigate the impact of specific policies on global food security. This is usually done by comparing the results of a baseline projection with those of a policy shock projection. Their difference can be regarded as a measure of the potential policy impact 54 . For the meta-regression (see below), we used only the sample of baseline studies, which used the same or very similar assumptions and therefore could be harmonized and compared. The policy shock projections, in contrast, use widely different assumptions to model a large number of policies, which makes it hard to include them in the meta-regression. To analyse these projections, we grouped them by policy and compared the results with the estimated range that resulted from our meta-regression (Supplementary Fig. 8). The comparison shows that nearly all policy shock projections fall within the estimated bandwidth, confirming our main findings.
After removing outliers and ‘No class’ projections (Supplementary Fig. 2), we conducted a meta-regression 55 on the baseline projections to obtain point estimates for the percentage change in per capita consumption, total food consumption and population at risk of hunger for the period 2010–2050, taking into account differences between SSPs and RCPs. To control for the clustering of observations into groups (for example, projections conducted with the same model or harvested from the same study), we estimated separate linear mixed models 56 for each of the three food security indicators:
where yij is the jth projection expressed as the percentage change between 2010 and 2050 in the ith group; β0 is the intercept; β1, . . . , βp are the fixed-effect coefficients; and x1ij, . . . , xpij are the fixed-effect regressors. We included fixed effects for all SSP–RCP combinations and dummy variables for pure (as opposed to derived) SSP and RCP scenarios. bi1, . . . , biq are the random effects for group i, and z1ij, . . . , zqij are the random-effect regressors. We added random effects for both study and model as we assume that, although comparable, outcomes will vary across both studies and models because of differences in study design and model specifications. The projections in our sample can be regarded as random samples of all projections that could have been observed. Under these assumptions, a random effects model (as opposed to a fixed effects model) is recommended for meta-regression analysis 55 . ϵij is the error for projection j in group i.
The model was estimated using a restricted maximum-likelihood routine as implemented by the lme4 R package 57 in combination with the lmerTest package 58 , which implements the Satterthwaite’s degrees of freedom method for mixed models. The results of the model were used to derive point estimates and 95% confidence intervals based on standard errors for all SSP–RCP combinations for which data are available (Extended Data Figs. 4 and 5). The point estimates and confidence intervals were calculated by evaluating equation (1) at the population-weighted average values of the fixed effects and zero mean for the random effect variables using the R effects package 59 . We used the step-down strategy 58,60,61 to select the model with the best fit. Independent variables, such as method, model base year and type of study, were dropped as a result of this procedure (Supplementary Section B). Point estimates for the percentage change were multiplied by the base year values to derive the level values for 2050.
There is a risk that the results of our study were affected by selection bias. To account for publication bias, we conducted an extensive search for both academic and grey literature. Of the 57 studies, 18 (32%) were unpublished at the time of our analysis. Additional estimations did not provide support for differences between projections from published and unpublished studies (Supplementary Table 5).
Another type of selection bias that potentially influenced our results is related to the fact that we were able to extract quantitative information from only a limited number of selected studies. This is not a problem by itself, as the mixed model we used for the meta-regression is designed to deal with data that represent a random sample of the total population. But in the case of non-random selection, the results of the meta-regression will be biased. A comparison of the main characteristics between studies for which quantitative data were extracted and those for which data were missing does not suggest major structural differences between these groups and hence does not provide evidence for selection bias (Supplementary Fig. 9). Where possible, we also compared the findings of these studies with the estimated SSP confidence bands from our meta-regression (Supplementary Tables 6 and 7). The strong overlap between the two provides additional evidence against the existence of selection bias in our analysed sample.
Finally, we investigated potential selection bias related to the ‘No class’ projections, which were excluded from the analysis because the underlying scenario assumptions were different from the SSP/RCP framework. A comparison shows that for all three indicators, almost all ‘No class’ projections fall within the estimated plausible range of global food security projections (Supplementary Fig. 10). Hence, excluding them probably had little impact on our results.
To better interpret the results of our analysis, it is important to discuss a number of limitations. First, to summarize and compare the methods of the global food security studies, we distinguished between three major approaches (simulation models, statistical extrapolation and expert input), of which the first was further decomposed into computable general equilibrium, partial equilibrium and other models. In practice, this classification was not always straightforward. For example, a number of studies 6,62 combine simulation modelling with statistical extrapolation to project future food security indicators. In several other studies, statistical approaches are used to estimate future food consumption, which is then used as an input into a larger simulation model. Examples of this approach are the iAP 63 and MAgPIE models 19 . To be consistent, we decided to use the ‘simulation models’ category for all studies in which food security indicators are presented in the context or as part of a model simulation study, while stand-alone statistical approaches, even when they are used as part of a model in other studies 13 , were classified as ‘statistical extrapolation’. Finally, in some studies, the models are linked with other models to deepen the analysis and cover a wider range of outcome indicators 64 to enrich the analysis. In such cases, we assumed that the model is still comparable to its stand-alone version.
Second, the information on the drivers of global food security should be interpreted with care. Not all studies provide full details on the model specification and hence which drivers can be incorporated in the model. Occasionally, we took information on the incorporation of driving forces from other studies in which the same model was used.
Third, most of the high-ranking models used for global food security analysis (Fig. 2b) are (part of) large-scale integrated assessment tools that are used for global climate change 65 , biodiversity 34 and land use 66 studies, among others. Such models are continuously updated and expanded to respond to new research questions. The reviewed studies do not offer sufficient information to track changes in model design and input data from one study to the other. Nonetheless, we think it is reasonable to assume that the core of the models does not change over time and that cross-model comparison is possible.
Fourth, we were not able to map a small number of projections to the SSP/RCP framework because the underlying scenarios were not compatible with the SSP storylines and/or RCP climate change assumptions (Supplementary Section A.2). The SSPs cover only four of the six scenario families identified by Van Vuuren and Carter 52 , which means that projections that belong to the two missing families (or even other not-yet-identified scenario families) are not captured by our analysis. A comparison shows that projections for missing scenario families are positioned within the plausible range of SSP/RCP-based global food security projections and therefore do not affect our results (Supplementary Fig. 10). If a sufficient number of projections from new scenario families become available, we can easily incorporate them in our assessment.
Finally, our analysis deals only with global-level projections. Several of the selected studies present food security projections at the broad regional level 13,64,67 that clearly indicate different patterns and futures, which we are unable to analyse. We tried to collect comparable information at the regional level, but as only a small number of studies cover and present such an analysis, and they often use different regional aggregations, a more disaggregated analysis was not feasible. For similar reasons, we were not able to distinguish between the demands for different food commodities. Only a few studies 68,69 present detailed information on the shifts in diet, and in most cases the results are not comparable due to differences in the composition of food groups, making wider comparison impossible.
Further information on research design is available in the Nature Research Reporting Summary linked to this article.
The core data used in the study were obtained from the selected studies (Supplementary Section E) including their supplementary information and data files. For a few studies, additional information was supplied by the authors upon request. Historical data for the selected food security indicators were taken from FAO 70 . The database with information from the 57 selected studies as well as the Global Food Security Projections Database are publicly available at the Zenodo repository: https://doi.org/10.5281/zenodo.4911252. A dashboard to visualize the projections is available at https://michielvandijk.shinyapps.io/gfsp_db_dashboard/.
We used R (ref. 71 ) for visualization and analysis. The complete code required to reproduce all figures as well as the meta-analysis is publicly available at the Zenodo repository: https://doi.org/10.5281/zenodo.4911251.
We thank J. Webbink, C. Barrasso and W. de Jong for their support with the systematic literature review. We thank T. Hasegawa, K. Wiebe, D. M. Croz, A. Tabeau and M. von Lampe for making unpublished data available and H. Valin for useful suggestions to improve the paper. This research was funded by a grant from the Stavros Niarchos Foundation as part of the Ethics, Politics, Knowledge and Our Planet’s Food Futures project of the Johns Hopkins Global Food Ethics Berman Institute of Bioethics and Policy Program and a grant from Wageningen University and Research. The funders had no role in study design, data collection and analysis, decision to publish or preparation of the manuscript.